

Related Articles


March 18, 2020
Our World in Data presents the data and research to make progress against the world’s largest problems.
This blog post draws on data and research discussed in our entry on Environmental impacts of food production and CO2 and Greenhouse Gas Emissions…

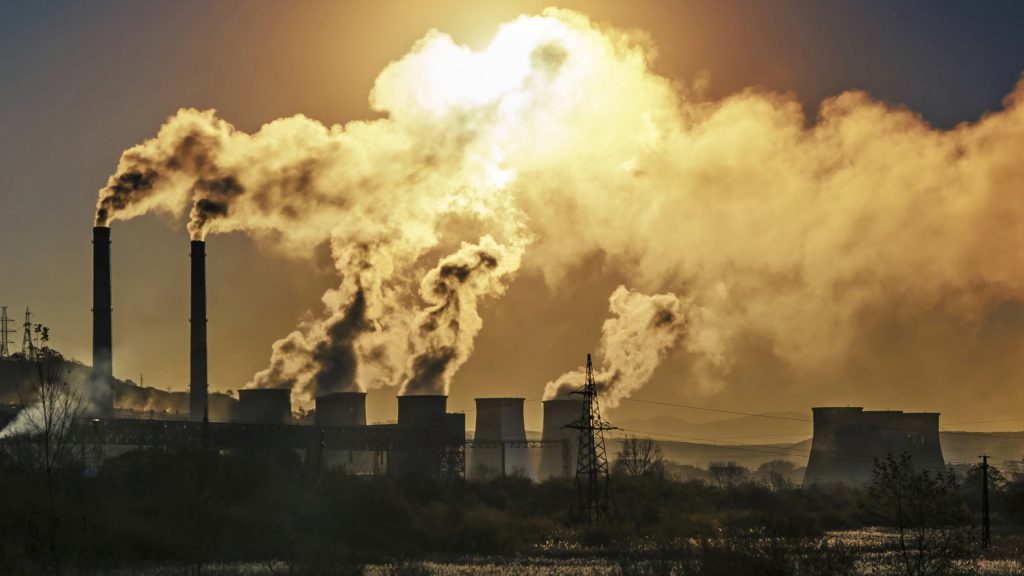
Food production accounts for around one-quarter – 26% – of global greenhouse gas emissions.1 This is a lot, but it’s slightly easier to digest when we remind ourselves that food is a basic human need.
What’s harder to make sense of is the amount of greenhouse gas emissions which are caused in the production of food that is never eaten.
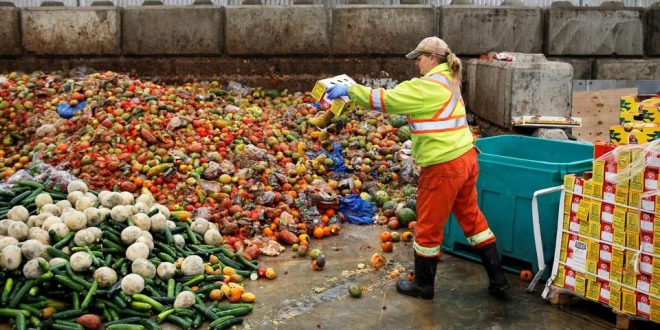
Around one-quarter of the calories the world produces are thrown away; they’re spoiled or spilled in supply chains; or are wasted by retailers, restaurants and consumers.2 To produce this food we need land, water, energy, and fertilizer inputs. It all comes at an environmental cost.
Joseph Poore and Thomas Nemecek (2018), in their large meta-analysis of global food systems, published in Science, estimated how much of our greenhouse gas emissions come from wasted food.3
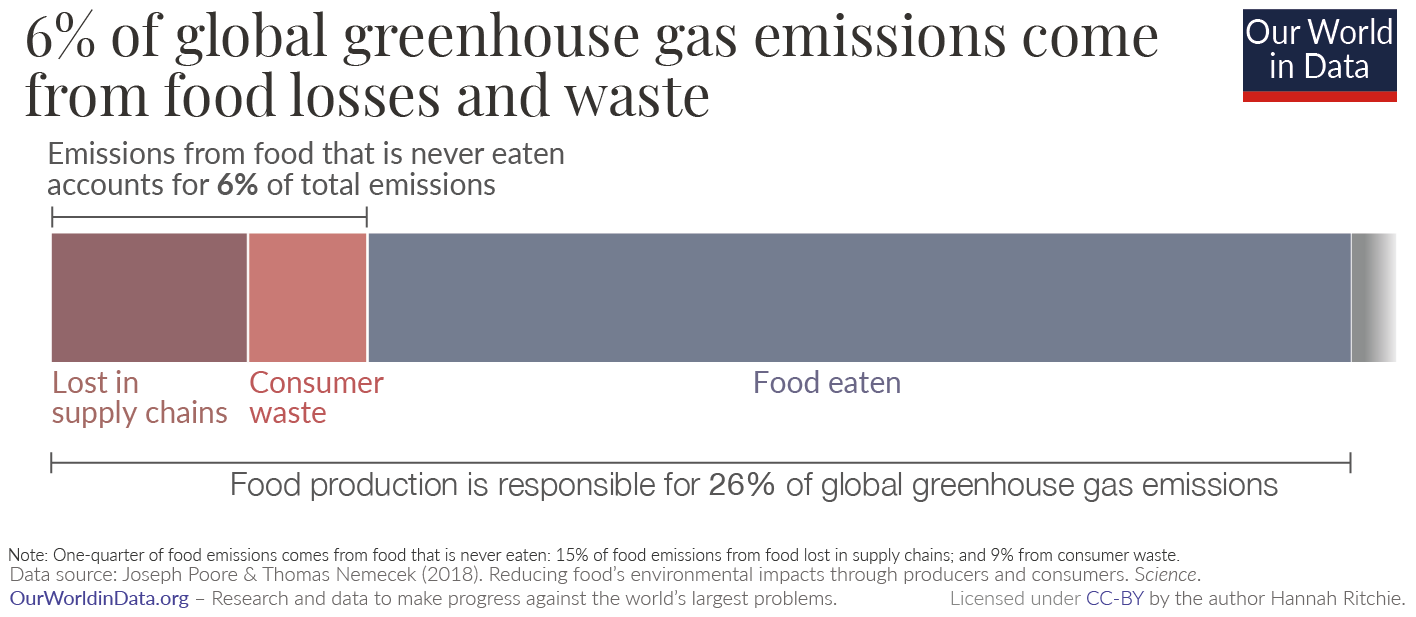
In the visualization here I show the emissions from wasted food in the context of global greenhouse gas emissions.
The study by Poore and Nemecek (2018) found that almost one-quarter – 24% – of food’s emissions come from food that is lost in supply chains or wasted by consumers. Almost two-thirds of this (15% of food emissions) comes from losses in the supply chain which result from poor storage and handling techniques; lack of refrigeration; and spoilage in transport and processing. The other 9% comes from food thrown away by retailers and consumers.
This means that food wastage is responsible for around 6% of total global greenhouse gas emissions.4 In fact, it’s likely to be slightly higher since the analysis from Poore and Nemecek (2018) does not include food losses on the farm during production and harvesting.
To put this in context: it’s around three times the global emissions from aviation.5 Or, if we were to put it in the context of national emissions, it would be the world’s third largest emitter.6 Only China (21%) and the United States (13%) emitted more.7
Endnotes
- Poore, J., & Nemecek, T. (2018). Reducing food’s environmental impacts through producers and consumers. Science, 360(6392), 987-992.
- Searchinger, T. et al. (2018). Creating a Sustainable Food Future—A Menu of Solutions to Feed Nearly 10 Billion People by 2050. World Resources Institute.
- Poore, J., & Nemecek, T. (2018). Reducing food’s environmental impacts through producers and consumers. Science, 360(6392), 987-992.
- Food production is responsible for 26% of global greenhouse gas emissions; and food waste is responsible for 24% of that figure. Therefore food waste as a share of global emissions is [24% * 26% = 6%].
- Latest data from the World Resource Institute’s CAIT Climate Data Explorer reports that aviation accounts for 1.9% of global greenhouse gas emissions. Food losses and waste accounts for around 6% – around three times the share from aviation. You can explore emissions by sector from the World Resources Institute here.
- This comparison of food waste and countries is now common, and sometimes criticised for the fact that it double-counts emissions.We’re comparing food waste with country emissions without accounting for the fact that these ‘food waste’ emissions are also included in national emissions figures. To make this accurate, the emissions of each country should be slightly lower than their reported values because we should remove the emissions from food waste for each.This is a valid criticism. However, even if we were to remove food waste emissions from each country’s total, this ranking would remain the same. Food waste would not fall down the rankings since its 4th placed competitor – India – would see a slight drop in emissions. And it’s not possible that it would overtake the United States or China; the amount of emissions therefore allocated to food waste would be much smaller than the current gap.If we accounted for this double-counting, the rankings would stay the same.
- The food system and losses data in the study by Poore and Nemecek (2018) relates to the year 2010. Emissions from food losses and waste were 3.3 billion tonnes of carbon-dioxide equivalents (CO2eq) – 2.1 GtCO2eq from supply chain losses, and 1.2 GtCO2eq from consumer waste.
The World Resource Institute’s CAIT Climate Data Explorer reports that in 2010, the top three emitters were China (9.8 GtCO2eq; 21%); the USA (6.1 GtCO2eq; 13%) and India (2.5 GtCO2eq; 5.3%). Food waste would therefore lie between the USA and India.